Table of Contents
Monitoring is one of the key factors required for managing clusters. Kubernetes API commands are used by operators to view the stat of the cluster. Kubernetes dashboard is the solution provided by the Kubernetes community for creating GUI which displays the details of the K8 cluster. There are multiple dashboard applications are available in this article we will see, kubernetes dashboard grafana
Grafana is an open-source software used for better handling, data monitoring, and visualization. Grafana along with Prometheus will help the operator perform many functionalities which are not present in the default Kubernetes dashboard, like setting up alerts for custom limits and getting a much more detailed and consolidated graphical representation with custom Kubernetes cluster metrics.
Requirement
- Integrate Grafana dashboard and Prometheus with Kubernetes Clusters
Setup details
- 1 Master with 3 Worker nodes with Flannel CNI
Step1: Create namespace
- Create a namespace called "monitoring"
[root@host~]# kubectl create ns monitoring
namespace/monitoring created
Step2: Download the Required file
- For this exercise, we will be referring and using MANIFESTs from GitHub project called prometheus-operator. This is an independently maintained project from the prometheus project
[root@host ~]# git clone https://github.com/prometheus-operator/kube-prometheus.git
- Once the repo is cloned, a directory named kube-prometheus will be created.
Step3: Create Required CRDs
- Custom Resource Definition available kube-prometheus/manifests/setup need to be applied
[root@host ~]# kubectl apply --server-side -f kube-prometheus/manifests/setup
Step4: Apply kubernetes MANIFEST files
- Multiple Kubernetes resources like configmap, secret, service, role, rolebinding, serviceacccounts, etc are reqired for deploying the dashboard
- MANIFEST file required for deploying the required resources are available at kube-prometheus/manifests/
[root@host ~]# kubectl apply -f kube-prometheus/manifests/
- Once the manifest is deployed wait till the pods are in running state
~]# kubectl get pods -n monitoring
NAME                                   READY   STATUS    RESTARTS        AGE
alertmanager-main-0                    2/2     Running   2 (5d12h ago)   22d
alertmanager-main-1                    2/2     Running   4 (5d12h ago)   22d
alertmanager-main-2                    2/2     Running   2 (5d12h ago)   22d
blackbox-exporter-6dfcb55b88-jccxk     3/3     Running   6 (5d12h ago)   22d
grafana-5dbb947f4-94sjq                1/1     Running   1               21d
kube-state-metrics-f4c97fc87-hncgl     3/3     Running   7 (5d12h ago)   22d
node-exporter-7x9jw                    2/2     Running   6 (5d12h ago)   22d
node-exporter-9jljf                    0/2     Pending   0               22d
node-exporter-dwb2b                    2/2     Running   4 (5d12h ago)   22d
node-exporter-rhlt4                    2/2     Running   4 (5d12h ago)   22d
prometheus-adapter-6455646bdc-d9j67    1/1     Running   3 (5d12h ago)   22d
prometheus-adapter-6455646bdc-pdzvf    1/1     Running   2 (5d12h ago)   22d
prometheus-k8s-0                       2/2     Running   2 (5d12h ago)   22d
prometheus-k8s-1                       2/2     Running   4 (5d12h ago)   22d
prometheus-operator-5474c49d55-wbx8g   2/2     Running   4 (5d12h ago)   22d
Step5 : Expose the deployments outside the cluster
- The deployed Prometheus and Grafana pods will be having cluster ip service created and assigned. But our requirement is to access the dashboard outside the cluster
- We will be using Nodeport service for exposing cluster ip service associated with Grafana and Prometheus pod, which inturn allow connection to the pod from outside the cluster
Note: Node port is not an optimal solution for exposing the service, we can use loadbalancer service or ingress for doing the same, but those are out of the scope of this article
- For creating Node port service, we will be needing the cluster ip service port, which can be obtained by listing the services
~]# kubectl get svc -n monitoring
NAME                    TYPE        CLUSTER-IP       EXTERNAL-IP   PORT(S)                         AGE
alertmanager-main       ClusterIP   10.109.233.111   <none>        9093/TCP,8080/TCP               22d
alertmanager-operated   ClusterIP   None             <none>        9093/TCP,9094/TCP,9094/UDP      22d
blackbox-exporter       ClusterIP   10.106.153.23    <none>        9115/TCP,19115/TCP              22d
grafana                 ClusterIP   10.97.12.179     <none>        3000/TCP                        22d
grafana-3000            NodePort    10.109.81.62     <none>        3000/TCP                        21d
grafana-9090            NodePort    10.111.104.122   <none>        9090/TCP,8080/TCP               21d
kube-state-metrics      ClusterIP   None             <none>        8443/TCP,9443/TCP               22d
node-exporter           ClusterIP   None             <none>        9100/TCP                        22d
prometheus-adapter      ClusterIP   10.111.193.27    <none>        443/TCP                         22d
prometheus-k8s          ClusterIP   10.110.0.204     <none>        9090/TCP,8080/TCP               22d
prometheus-operated     ClusterIP   None             <none>        9090/TCP                        22d
prometheus-operator     ClusterIP   None             <none>        8443/TCP                        22d
- From the above snippet it can be seen that Ggrafana's cluster ip service is listening at 3000 and Prometheus is at 9090.
- Node port service can be deployed using below commands
kubectl expose service grafana --type=NodePort --target-port=3000 --name=grafana-3000 -n monitoring
kubectl expose service prometheus-k8s --type=NodePort --target-port=9090 --name=grafana-9090 -n monitoring
- Since we are using the Node port service, we need to identify the node and node port where the Grafana and Prometheus is running. This can be identified using kubectl get pods and get nodes command
]# kubectl get pods -o wide -n monitoring
NAME                                   READY   STATUS    RESTARTS      AGE    IP           NODE      NOMINATED NODE   READINESS GATES

grafana-5dbb947f4-94sjq                1/1     Running   0             145m   10.44.0.7    w2-test   <none>           <none>
prometheus-k8s-0                       2/2     Running   0             14h    10.44.0.11   w2-test   <none>           <none>
prometheus-k8s-1                       2/2     Running   0             14h    10.36.0.12   w1-add    <none>           <none>
prometheus-operator-5474c49d55-wbx8g   2/2     Running   0             14h    10.36.0.10   w1-add    <none>           <none>
<trimmed>

~]# kubectl get nodes -o wide
NAME      STATUS     ROLES                  AGE   VERSION   INTERNAL-IP   EXTERNAL-IP   OS-IMAGE                KERNEL-VERSION           CONTAINER-RUNTIME
c1        Ready      control-plane,master   21d   v1.23.6   10.55.5.71    <none>        CentOS Linux 7 (Core)   3.10.0-1127.el7.x86_64   docker://20.10.14
w1-add    Ready      <none>                 20d   v1.23.6   10.55.7.7     <none>        CentOS Linux 7 (Core)   3.10.0-1127.el7.x86_64   docker://20.10.14
w1-test   NotReady   <none>                 21d   v1.23.6   10.55.7.41    <none>        CentOS Linux 7 (Core)   3.10.0-1127.el7.x86_64   docker://20.10.14
w2-test   Ready      <none>                 21d   v1.23.6   10.55.5.80    <none>        CentOS Linux 7 (Core)   3.10.0-1127.el7.x86_64   docker://20.10.14
- In our case the pods are running on nodes w2-test
- Node port can be identified by listing the services in the namespace monitoring.
~]# kubectl get svc -n monitoring
NAME                    TYPE        CLUSTER-IP       EXTERNAL-IP   PORT(S)                         AGE
alertmanager-main       ClusterIP   10.109.233.111   <none>        9093/TCP,8080/TCP               22d
alertmanager-operated   ClusterIP   None             <none>        9093/TCP,9094/TCP,9094/UDP      22d
blackbox-exporter       ClusterIP   10.106.153.23    <none>        9115/TCP,19115/TCP              22d
grafana                 ClusterIP   10.97.12.179     <none>        3000/TCP                        22d
grafana-3000            NodePort    10.109.81.62     <none>        3000:32445/TCP                  21d
grafana-9090            NodePort    10.111.104.122   <none>        9090:30313/TCP,8080:30803/TCP   21d
kube-state-metrics      ClusterIP   None             <none>        8443/TCP,9443/TCP               22d
node-exporter           ClusterIP   None             <none>        9100/TCP                        22d
prometheus-adapter      ClusterIP   10.111.193.27    <none>        443/TCP                         22d
prometheus-k8s          ClusterIP   10.110.0.204     <none>        9090/TCP,8080/TCP               22d
prometheus-operated     ClusterIP   None             <none>        9090/TCP                        22d
prometheus-operator     ClusterIP   None             <none>        8443/TCP                        22d
- In our case grafans is exposed on 30313and Prometheus on 32445. Hence the urls will be
- http://10.39.251.152:32445 for Grafana and http://10.55.5.80:30313
- These take a note of these urls, as these are required later
- The dashboards of the grafana and Prometheus will be accessible from the browser
Note: If it is not accessible, pls enable the port mentioned in the Nodeport service (30313-32445) in the firewall
Step6: Set the Prometheus entry as data sources
- Edit grafana-dashboardDatasources.yaml in kube-prometheus/manifests and update the url (fqdn to be changed to ip and port). This is required since we are exposing the service via node ip
- Prometheus url need to be provided, in our case http://10.55.5.80:30313 , is to be updated.
- Apply the edited MANIFEST file to the namespace
kubectl apply -f grafana-dashboardDatasources.yaml -n monitoring
- Below snippet shows the sample edited yaml file
apiVersion: v1
kind: Secret
metadata:
  labels:
    app.kubernetes.io/component: grafana
    app.kubernetes.io/name: grafana
    app.kubernetes.io/part-of: kube-prometheus
    app.kubernetes.io/version: 8.5.2
  name: grafana-datasources
  namespace: monitoring
stringData:
  datasources.yaml: |-
    {
        "apiVersion": 1,
        "datasources": [
            {
                "access": "proxy",
                "editable": false,
                "name": "prometheus",
                "orgId": 1,
                "type": "prometheus",
                "url": "http://10.55.5.80:30313",
                "version": 1
            }
        ]
    }
type: Opaque- After the MANIFEST file is updated/applied, delete the Prometheus pod for getting these changes reflected
kubectl delete pod grafana-5dbb947f4-94sjq -n monitoring
- Once the pod comes into a running state, the urls will be accessible and can be used in any browser
- The default password for grafana is (admin/admin)
Step 7: Verify the data source in Grafana dashbord
- Use any browser to access the Grafana dashboard via http://<nodeip>:<nodeport>. In our case it is http://10.39.251.152:32445
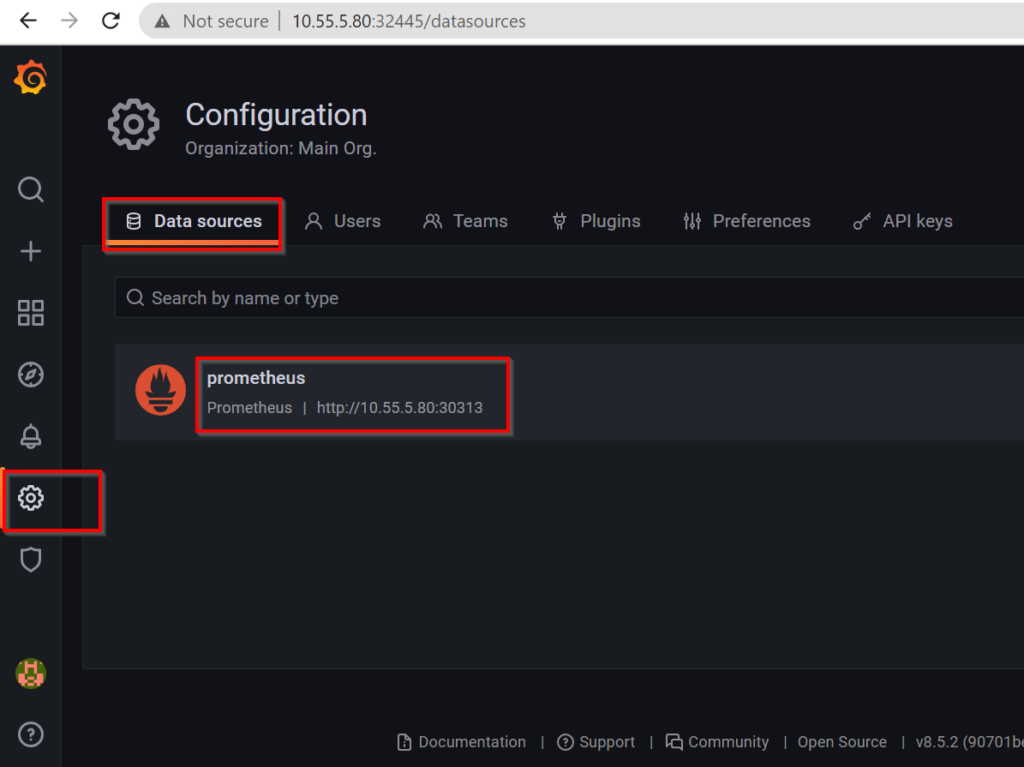
- Go to Settings --> Datasource
- Click on the Prometheus label and you will be able to see the Prometheus URL , refer sample snippet
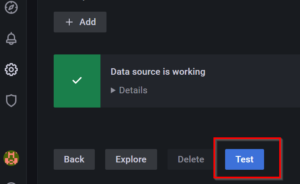
- Navigate to the bottom of the window and click on Test
- You will be seeing a "Data source is working" message on the screen
Step 8: Configure Dashboards
- Now that the data source is working, we can configure dashboard according to our need. we can either create dashabord or import a dashboard.
- For the scope of this article, I'm importing a dashboard from the grafana official website
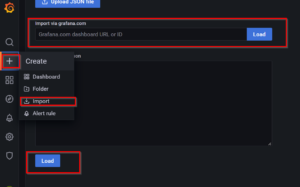
- Click on "+" on the Grafana home page and then click on import. you will be seeing a window like below, there we can provide JSON file or dashboard id
- For this article I'm using grafana Kubernetes dashboard template dashboard id "315".
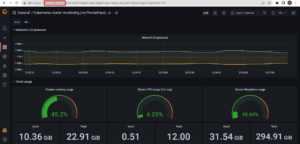
- Once the dashboard is imported, you can access and view the state of the cluster in the dashboard
Key points to Note:
- Firewall needs to be enabled for the assigned Node portschange background of photo online
- Namespace "monitoring" is hardcoded
- Create custom alert rules in Prometheus for getting user-defined alerts


